Chapter 14: IR and Mass Spectroscopy
No description yet. This curated deck is ready for daily study.
Card preview (22)
Diagnostic region IR Spectroscopy
Above 1500 cm−1
Analyzing an IR spectrum IR Spectroscopy
Focus on the diagnostic region; analyze wavenumber, intensity, and shape for each signal • 1600-1850 cm−1− check for double bonds • 2100-2300 cm−1− check for triple bonds • 2700-4000 cm−1− check for X−H bonds Focus on the region above 3000 cm-1
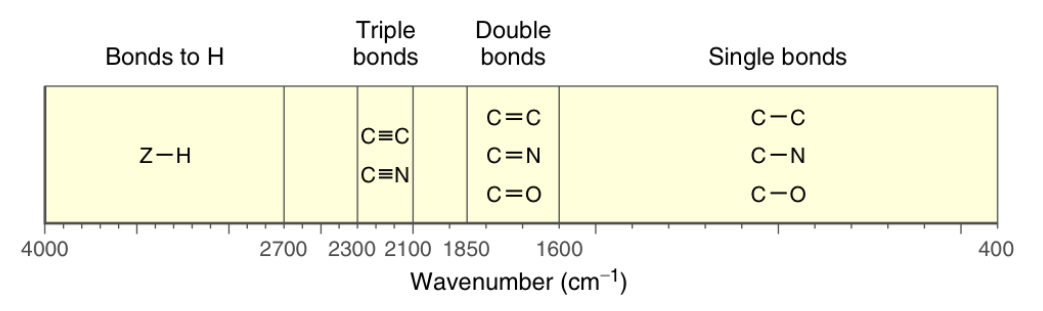
Double bond region IR Spectroscopy
1600−1850 cm−1
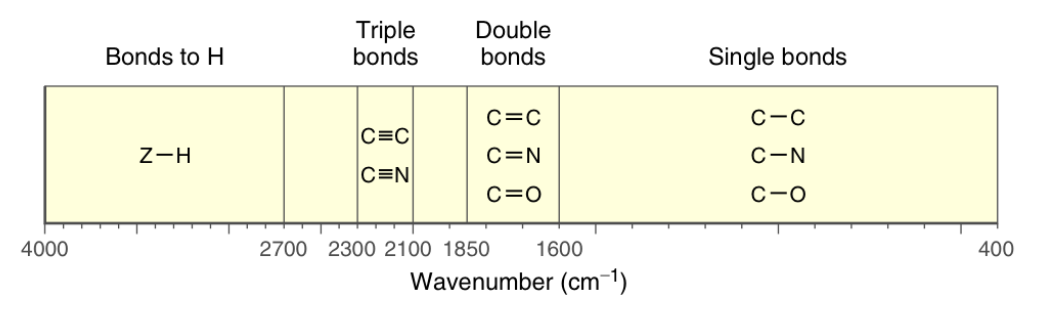
Triple bond region IR Spectroscopy
2100−2300 cm−1
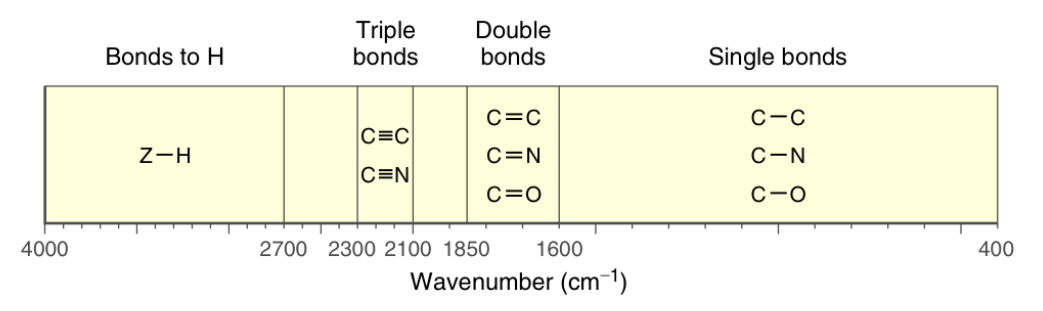
Bonds to hydrogen IR Spectroscopy
Greater than 2700 cm−1
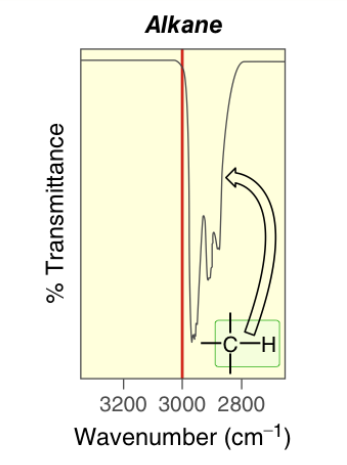
sp3 C−H bonds IR Spectroscopy
~2900 cm−1
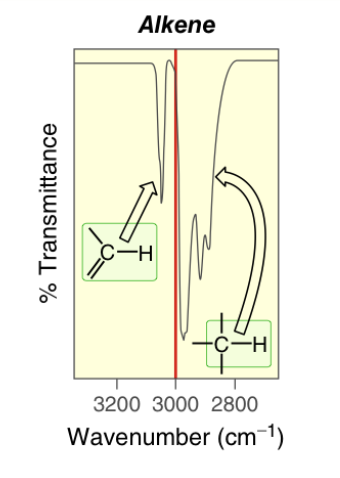
sp2 C−H bonds IR Spectroscopy
~3100 cm−1
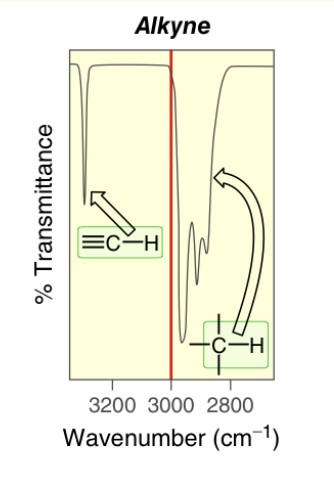
sp C−H bonds IR Spectroscopy
~3300 cm−1
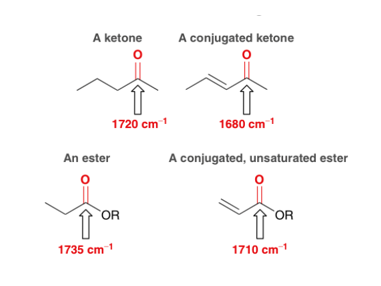
Effect of resonance on wavenumber IR Spectroscopy
Lowers wavenumber by 20−40 cm−1 More resonance structures stabilize a bond and thus decrease its energy
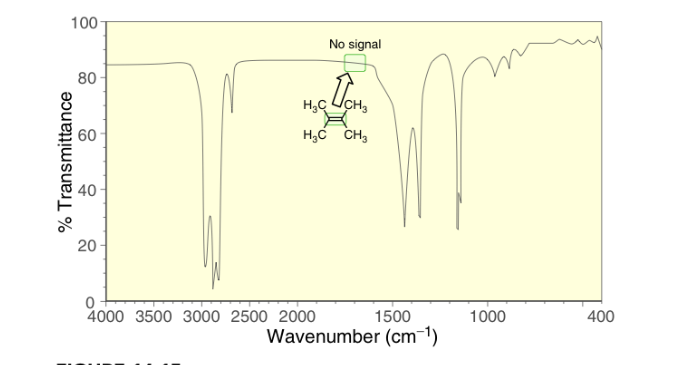
Effect of symmetry on wavenumber IR Spectroscopy
Symmetry dampens a signal making it invisible Tetrasubstituted double bonds and internal triple bonds do not produce a signal when R groups are identical due to no net dipole moment
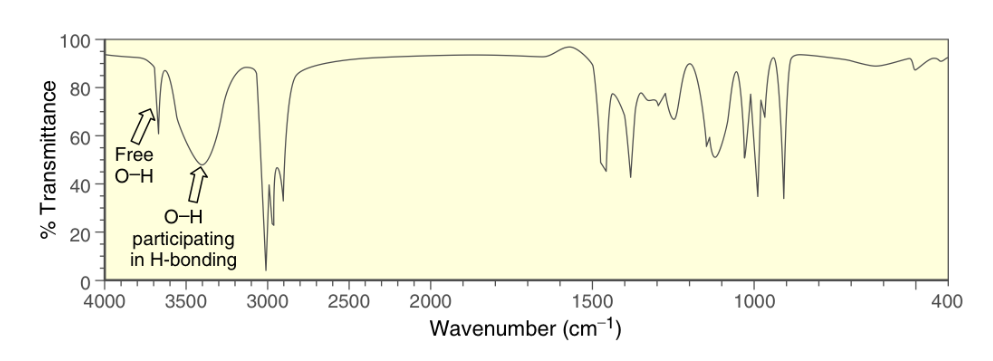
Hydroxyl signal IR Spectroscopy
−OH groups produce broad signals from 3200−3600 cm−1 when in concetrated solutions due to hydrogen bonding −OH groups produce narrow signals around 3600 cm−1 when in when diluted in a solvent that cannot form hydrogen bonds with the alcohol
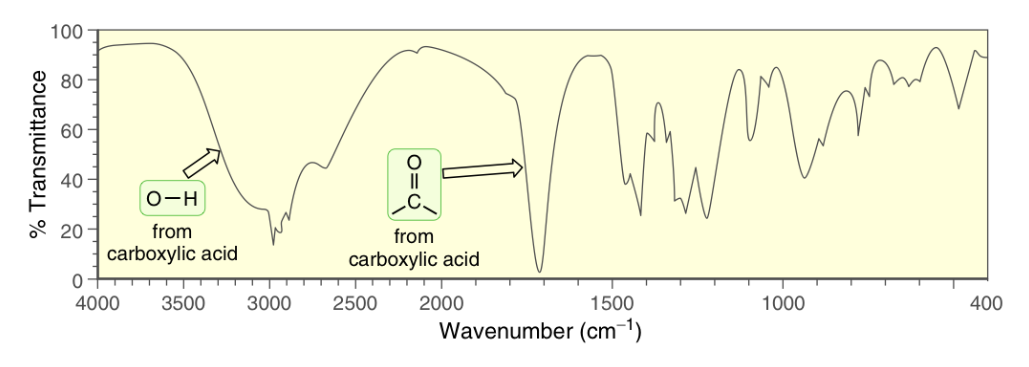
Carboxylic acid signal IR Spectroscopy
−COOH groups produce a very broad signal from 2200−3600 cm−1 corresponding to the carboxylic −OH A strong narrow signal at ~1700 cm−1 will also be present corresponding to the carbonyl group
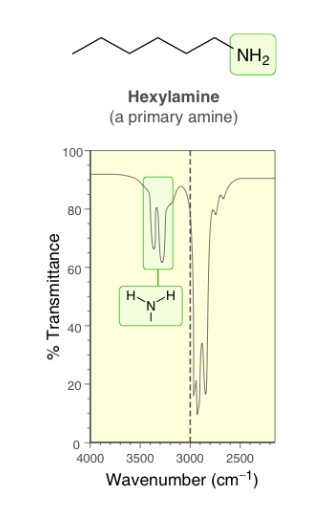
Primary amine signal IR Spectroscopy
−NH2 groups produce two signals at 3350 and 3450 cm−1
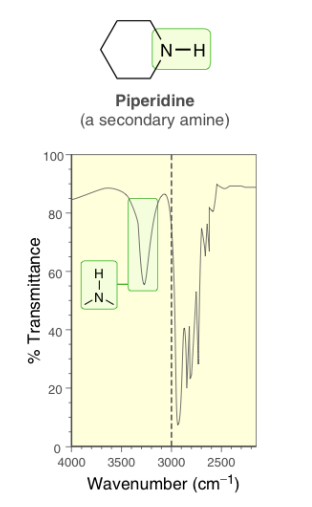
Secondary amine signal IR Spectroscopy
−NH groups produce one signal ~3450 cm−1
Carbonyl signals IR Spectroscopy
C=O groups produce a strong narrow signal around or above 1700 cm−1 Typically the most prominent signal Conjugation will lower carbonyl signals by about 20−40 cm−1

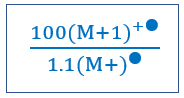
Predicting molecular formula from (M+1)+● peak Mass Spectrometry
• Determine number of carbon atoms in the compound by analyzing the relative abundance of the M+1 peak− (M+1)+● relative height divided by the (M+)+● relative height times 100; divide this value by 1.1 to find the number of carbons • Analyze the remaining mass of the molecular ion to determine what other atoms may be present; likely oxygen or nitrogen (will give an odd molecular weight) Simplified below
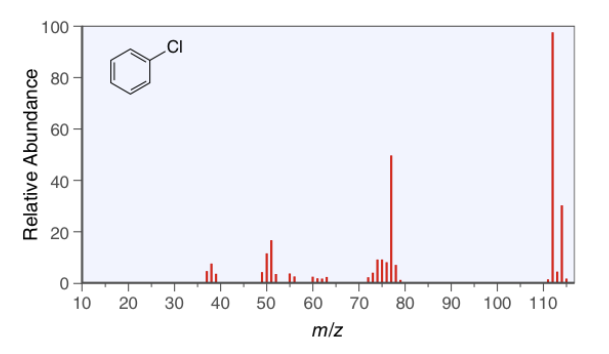
Chlorine (M+2)+● peak Mass Spectrometry
(M+2)+● peak of chlorine will be approximately one-third the height of the molecular ion (M+)+● peak
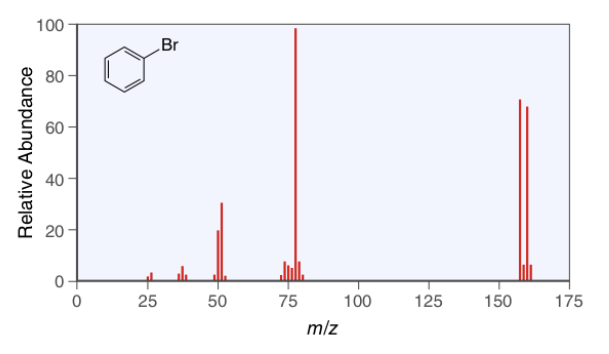
Bromine (M+2)+● peak Mass Spectrometry
(M+2)+● peak of bromine will be approximately the same height as the molecular ion (M+)+● peak
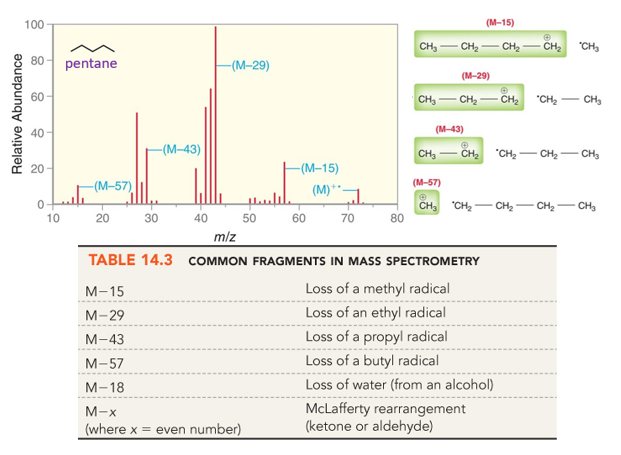
Analyzing IR fragments Mass Spectrometry
MS can only detect charged species; including fragments Thorough analysis can give structural information Charged species will still prefer most stable cation or anion; the more abundant ion will be the more stable one
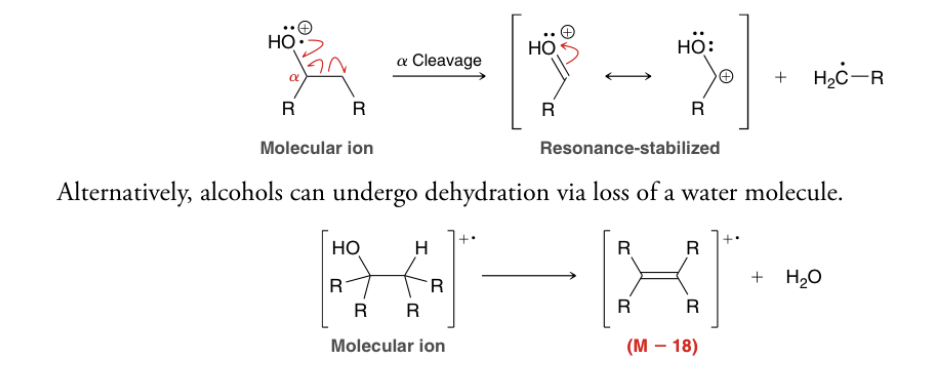
Alcohol fragments Mass Spectrometry
A signal at M−18 is characteristic of an alcohol The hydroxyl group itself will not usually exhibit a molecular ion peak
Calculating degree of unsaturation
A fully saturated alkane will have 2n+2 hydrogen atoms where n is the number of carbon atoms Calculation of HDI • Count the total number of hydrogens in molecule; look at the molecular formula • Add one H for each halogen • Ignore oxygen • Subtract one H for each nitrogen • Subtract this number from 2n+2 and divide by 2
HDI patterns
HDI 0 Compound is fully saturated and has no π bonds or rings HDI 1 • One π bond • One non-aromatic ring HDI 2 • Two π bonds • One triple bond • Two non-aromatic rings • One non-aromatic ring and one π bond HDI 4 Potentially indicates an aromatic ring