Lecture 4 – Data quality
No description yet. This curated deck is ready for daily study.
Card preview (13)
What are the 4 Vs of big data?
Volume Velocity Variety Veracity
4Vs: What does Velocity refer to?
The speed at which data is generated - sensors generate data every seconds - interactions on a website create data every second high velocity –> analysis of streaming data
4Vs: What does Volume refer to?
Scale of data Datasets in Terrabytes or Petabytes –> too big to process by a single processing computer –> new data storage and processing technology
4Vs: What does Veracity refer to?
Uncertainty of data Quality of the data (high veracity = valuable to analyze and contributes in a meaningful way, low veracity = not valuable, inaccurate, not contributing)
4Vs: What does Variety refer to?
Different forms of data (sources, formats, structured/unstructured)
Which of the 4Vs are related to each growth law?
Moore’s: Velocity & Variety Koomey’s: Variety Bell’s: Variety & Veracity Zimmerman’s: all of them
Elements of the NIST Framework
Data sources Data volume Data velocity Data variety Data veracity Software Analytics Processing Capabilities Security/Privacy Lifecycle Other
What is data wrangling?
Cleaning the data so it can be used
Issues related to the 4Vs that data wrangling may need to correct for?
Volume: with a lot of data, irregularities creep in Velocity: data can be our-of-date quickly Variety: data can be of different formats and types Veracity: the accuracy of consistency of data from different sources or sets
R: What is the difference between NA and NaN
NA = not available, missing data point NaN = not a number, undefined or unrepresentable value (e.g. we divided number by 0)
What are possible strategies to deal with missing data?
• omit them from the data (drop whole column, or drop observations) • give them a value (impute)
What is the purpose of the shadow matrix in R?
see how missing values relate to other variables in the table
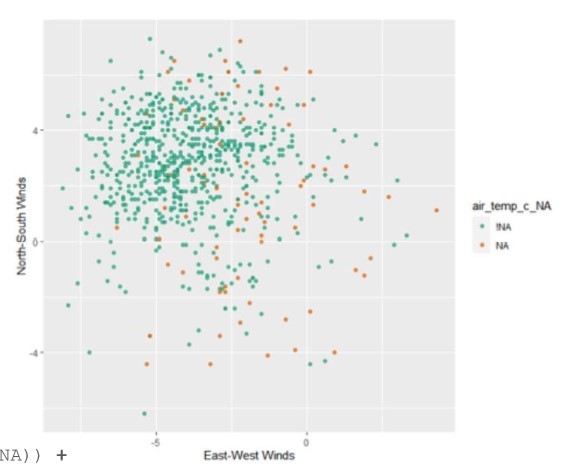
Different methods for imputation?
Simple parametric: use mean/median Simple non-parametric: find the k nearest neighbors and average these multiple imputation: use a statistical distribution and simulate for the missing values