Organic 6: Organic Analysis
No description yet. This curated deck is ready for daily study.
Card preview (20)
How do you test for alkenes?
Mix with bromine water Positive result: Turns colourless from orange-brown
How do you test for halogenoalkanes?
Test for halogenoalkanes: 1) Add aqueous warm NaOH to neutralise any acids present or remove interfering substances 2) Acidify with nitric acid to remove carbonate ions and acidify the solution 3) Add silver nitrate: If chlorides are present: White precipitate If bromides are present: Cream precipitate If iodides are present: Pale yellow precipitate To further test to identify specific halides: Chlorides: dissolves in dilute ammonia Bromides: dissolves in concentrated ammonia Iodide: insoluble in concentrated ammonia
How do you test for primary or secondary alcohols?
Add acidified potassium dichromate (K2Cr2O7) Dichromate ions (orange) - Cr2O72 Reduced to chromium(III) ions (green) - Cr3+ Positive result = orange –> green
How do you test for aldehydes?
Warm with Fehling’s or Tollen’s solution Positive result for Fehling’s: Blue –> red precipitate Positive result for Tollen’s: Forms silver mirror
How do you test for carboxylic acids?
Add sodium carbonate (Na2CO3) Gives off bubbles of CO2 Also produces water and sodium carboxylate
If a compound is acidic, what does this suggest?
It could be a carboxylic acid
If a compound is solid, what does this suggest?
Long carbon chain Ionic bonding
If a compound is liquid, what does this suggest?
Medium carbon chain Polar/hydrogen bonding
If a compound is gaseous, what does this suggest?
Short carbon chain Little to no polarity
What does solubility in water suggest?
Polar groups are present
What is mass spectrometry used for?
Finding the relative molecular mass of organic compounds
Describe how infrared spectroscopy works.
1) A beam of infrared radiation containing a spread of frequencies is passed through a sample 2) The radiation that emerges is missing the frequencies that correspond to the types of bonds found in the sample 3) The instrument plots a graph of the intensity of the radiation emerging from the sample (transmittance) against frequency of radiation 4) Frequency is expressed as a wavenumber, measured in cm-1
Describe the IR peak of an OH bond in an alcohol.
Smoother, rounded curve
Describe the IR peak of an OH bond in a carboxylic acid.
Broader trough More jagged than alcohol
Describe the IR peak of a C=O bond.
Long narrow peak Around the middle of the spectrum
Describe the IR peak of a C-O bond in alcohols and esters.
Long jagged peak To the right of the middle of the spectrum
What is the fingerprint region of an IR spectrum?
Many peaks caused by complex vibrations Unique for every substance Used to identify the chemical Chemists use a computer to match this fingerprint region to those on a database
Predict what functional group(s) this spectrum might show.
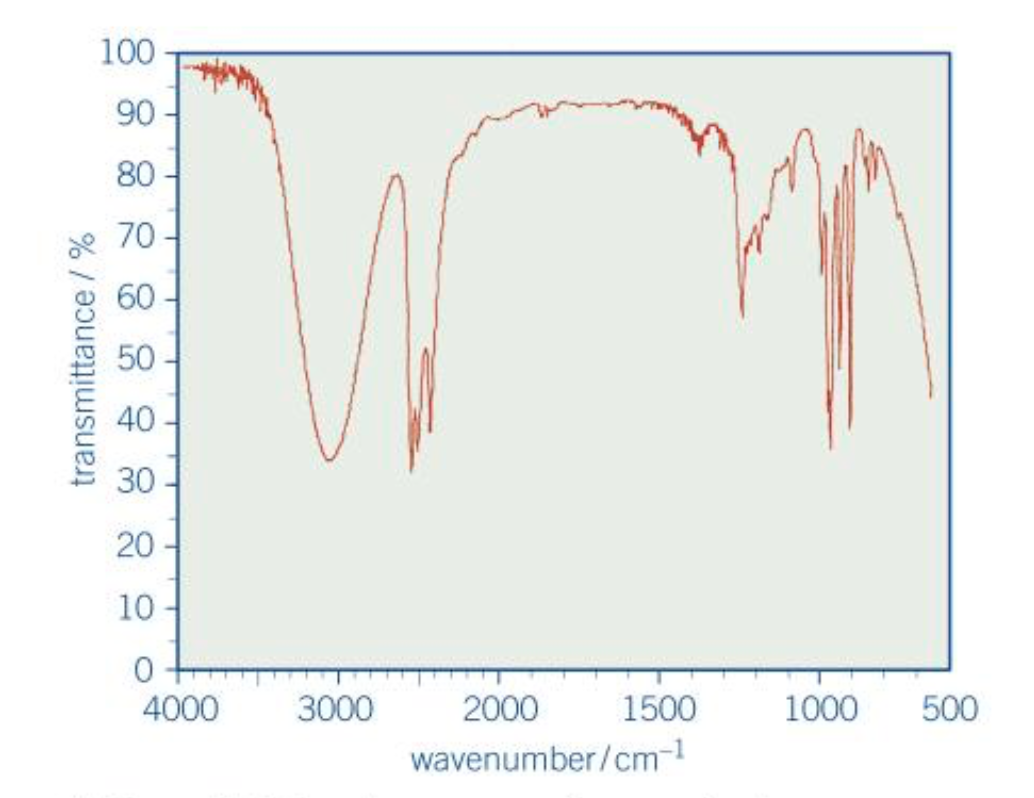
Alcohol
Predict what functional group(s) this spectrum might show.
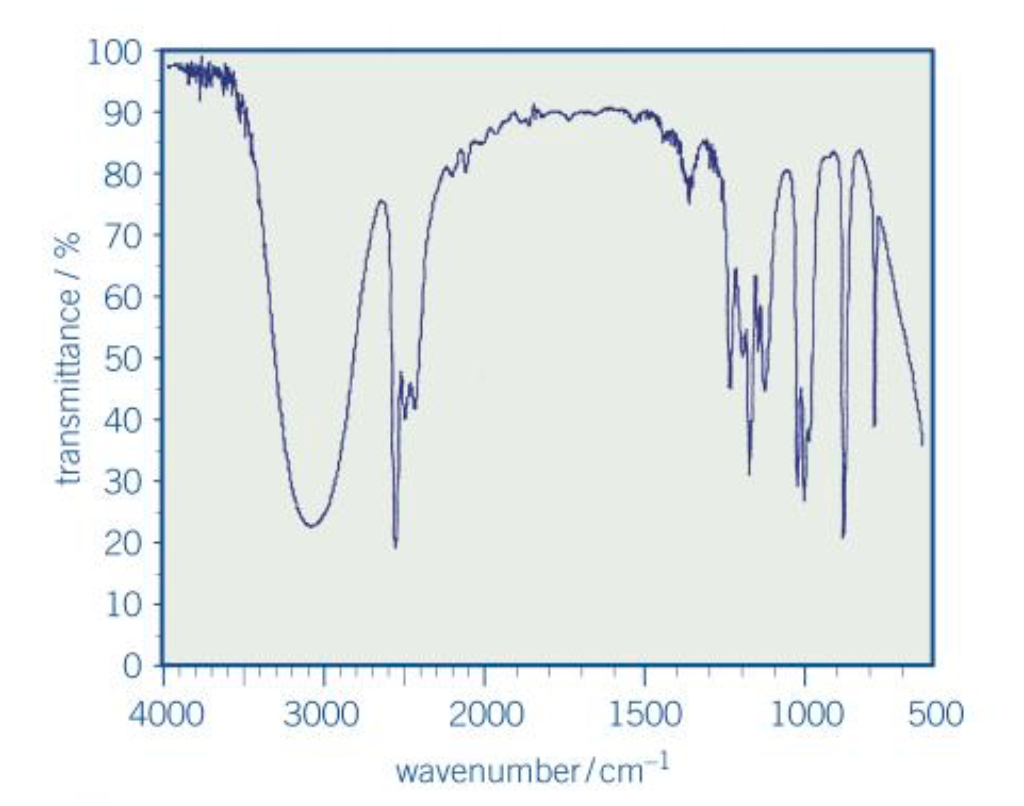
Alcohol
Predict what functional group(s) this compound might show
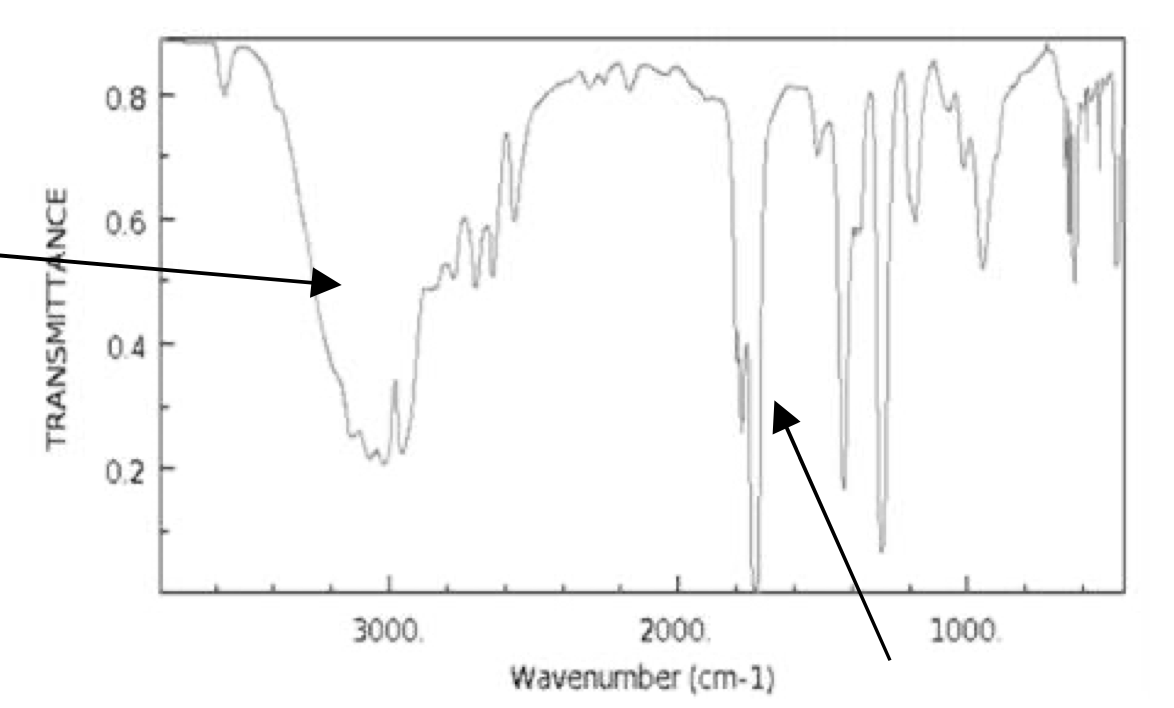
C=O O-H in an acid Suggests carboxylic acid