CH 3, 3-3 Measures of Relative Standing and Boxplots
No description yet. This curated deck is ready for daily study.
Card preview (13)
What is the number of standard deviations that a given value x is above or below the mean?
z number
What is the formula for finding a z score?
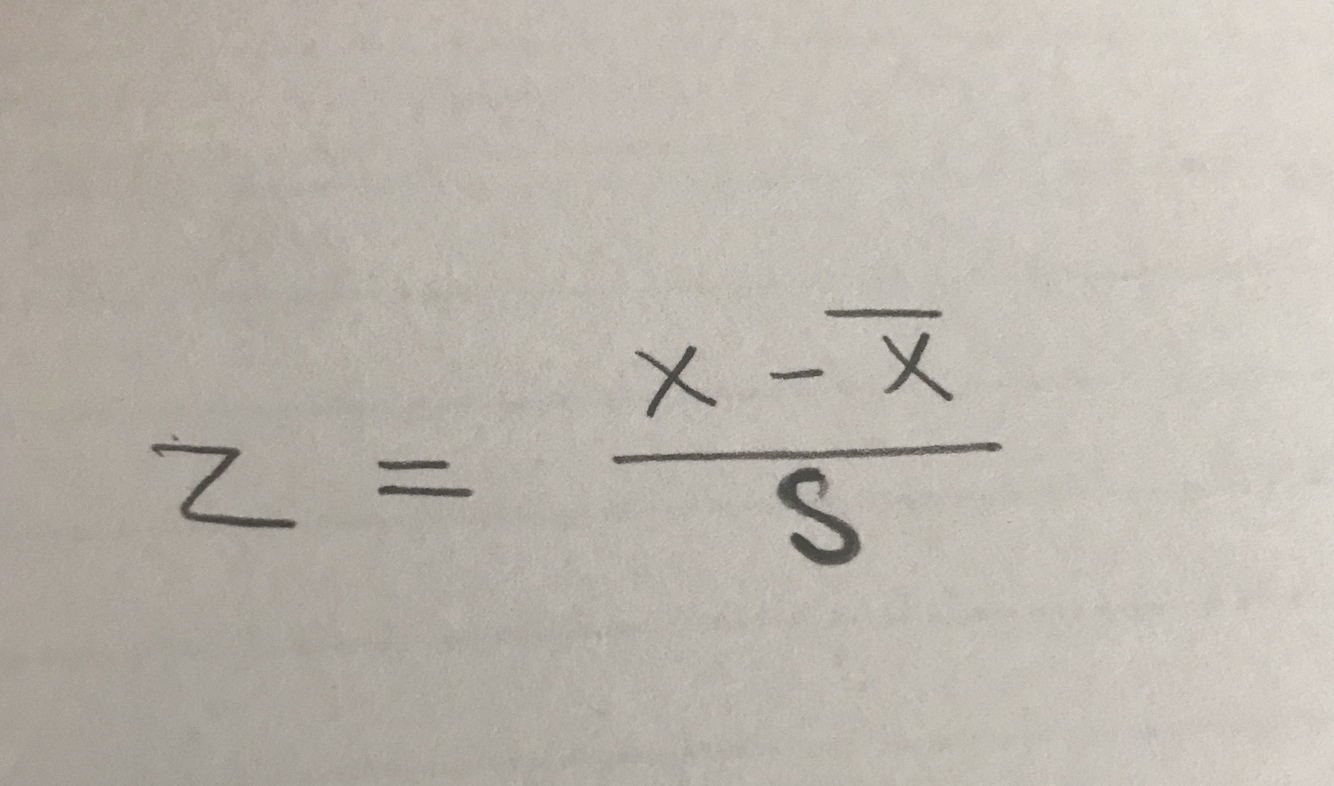
What are the round off rules for z scores?
two decimal places
What determines is a z score is significantly low or significantly high?
less than or equal to -2 values are signficantly low greater than or equal to +2 values are significantly high
What are measrues of location denoted with P1, P2, …, P99, which divide a set of data into 100 groups with about 1% of the values in each group?
Percentiles
What is the formula for finding the percentile of a data value?
= (number of values less than x / total number of values) * 100
What formula converts a percentile to a data value?
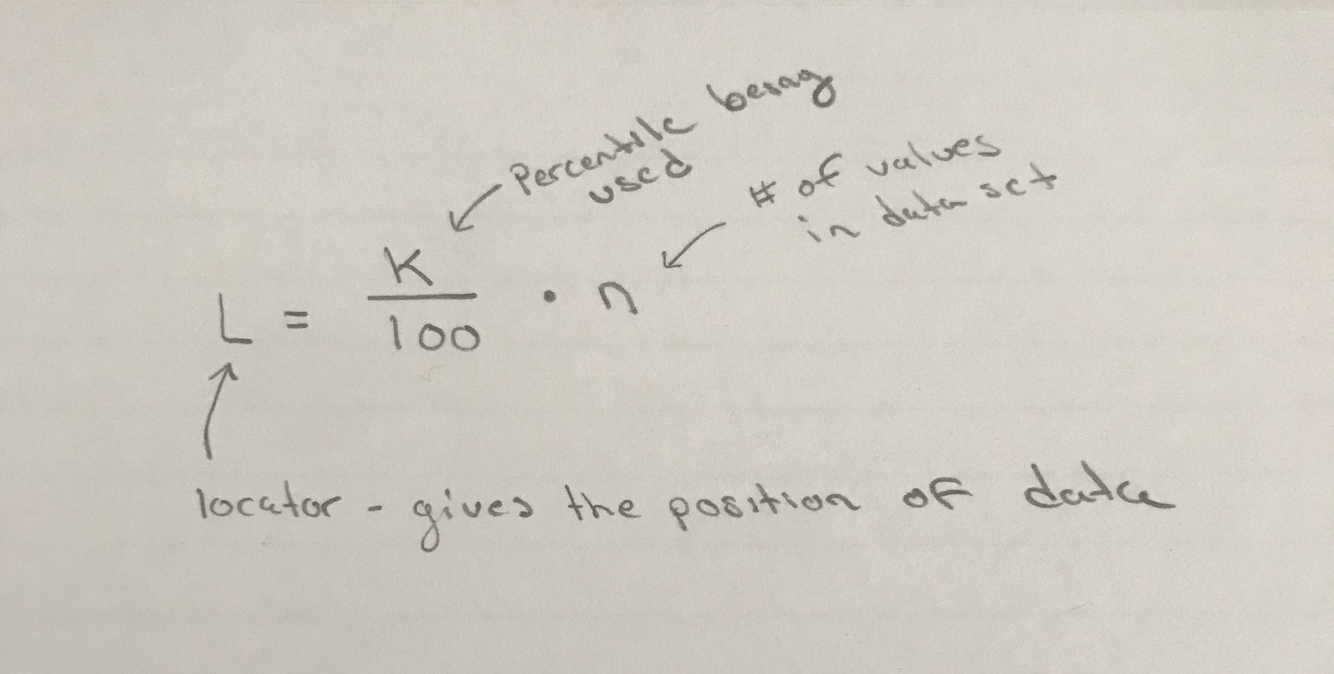
What are measures of location, denoted Q1, Q2, and Q3, which divide a set of data into four groups with about 25% of the values in each group?
Quartiles
In which quartile is at least 75% of the stored values less than or equal to said quaritle and 25% fo the values are greater?
Q3
What five values does the 5-number summary consist of?
Minimum Q1 Q2 Q3 Maximum
What is a graph of a data set that consitis of a line extending from the mimimum value to the maximum value and a box with lines drawn at the fist quartile, the median, and the third quartile?
boxplot or box-and-whisker diagram
How do you calculate the interquartile range? (IQR)
IQR = Q3 - Q1
What are the steps in identifying an Outlier for Modifiied Boxplots?
Find Q1 Q2 Q3 Find the IQR Evaluate 1.5 * IQR Value is an outlier if it is above Q3 by an amount greater than 1.5 * IQR Or bellow Q1 by an amount greater than 1.5 * IQR