3.6 Organic Analysis
No description yet. This curated deck is ready for daily study.
Card preview (23)
How do you test for alkenes? What is the result?
Shake with bromine water, result is bromine water is delocolouised (orange to colourless)
How do you test for carboxylic acids? What is the result?
Add Na2CO3 (aq), result: COs (g) given off- effervescence
How do you test for halogenoalkanes? What is the result?
Add NaOH (aq) and warm, acidify with HNO3, add AgNO3 (aq) Result: precipitate of AgX (for CL= white, for Br= cream, for I= yellow)
How do you test for alcohols? What is the result?
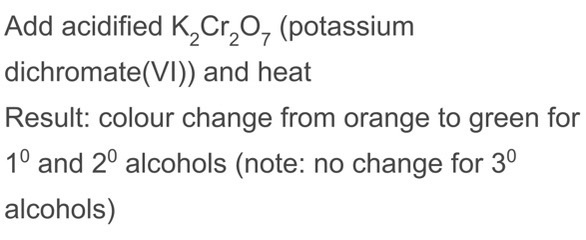
How do you test for aldehydes? What is the result? (2)
• Warm Fehling’s solution, result: brick red ppt forms (from blue solution) • Warm with Tollens’ reagent, result: “silver mirror” (Ag(s) ppt) forms
How do you test for carboxylic acids? What is the result?
Add Na2CO3 (aq), result: CO2 (g) given off- effervescence
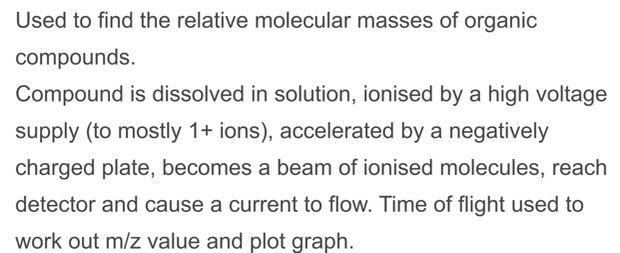
What is mass spectrometry? How does it work?
What does the x-axis show on a mass spectrum? What does this effectively show and why?
Shows m/z value (mass divided by ionic charge). Since most ions are 1+, this effectively show Mr
Why are there multiple peaks when molecules are put into a mass spectrometer?
The molecular ion is shown as a peak, but it will also FRAGMENT into smaller molecules, so these peaks are shown as well Also, due to isotopes of atoms, different peaks may be seen
How does gas chromatography work and what does it tell you?
A stream of gas carries a mixture of vapours through a column packed with solids, different compounds move through at different speeds, so they are separated. The amount of each compound can then be measured
What does GCMS stand for?
Gas chromatography linked to mass spectrometry
What might GCMS be used for?
Powerful chemical analysis- forensic work, measure water pollution, drug testing on athletes, racehorses
What is high resolution mass spectrometry?
Mass spectrometers which give Mr to 3.d.p or 4.d.p are called high resolution (low resolution is to nearest whole number)
What does high resolution mass spec allow you to do?
Distinguish between compounds that have the same Mr to the nearest whole number, but are made up of different atoms and therefore have different values of Mr to 3.d.p
What does high resolution mass spec allow you to do ?
Distinguish between compounds that have the same Mr to the nearest whole number, but are made up of different atoms and therefore have different values of Mr to 3.d.p
Why do atoms and chemical bonds absorb infrared radiation?
They are constantly vibrating- they can absorb infrared radiation that is the same frequency as their frequency of vibration
What effect does a stronger bond have on the frequency of vibration?
Vibrate faster (with higher frequency)
What effect do heavier atoms have on the frequency of vibration?
Vibrate slower (with lower frequency)
How does infrared spectroscopy work?
Every bond has a unique vibration frequency in the infrared region of the EM spectrum Bonds absorb radiation that has the same frequency as their frequency of vibration Infrared radiation emerged from a sample that is missing the frequencies that have been absorbed —> this information can be used to identify the compounds functional group
What happens inside an infrared spectrometer?
Beam of infrared radiation with a range of frequencies is passed through the sample Radiation that emerges is missing frequencies that have been absorbed by the bonds in the sample Graph is plotted of intensity against frequency of radiation
What do the troughs on an infrared spectrum show?
The frequencies where radiation has been absorbed- match to table to find out which bonds they represent
What is the fingerprint region?
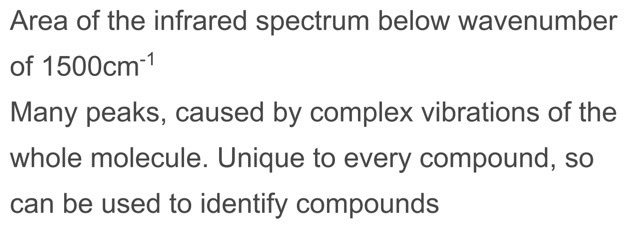
How is the finger print region used to identify compounds?
The fingerprint region’s pattern is matched to a database on a computer to identify the compound accurately