Week 3
No description yet. This curated deck is ready for daily study.
Card preview (14)
What types of graph work with two categorical variables?
Contingency table Grouped bar graph Mosaic plot
What types of graph work with two Numerical variables?
Scatter plot Line plot (space or time)
What types of graph work with numerical explanatory variable and categorical response variable?
More complex plots of GLMS
What types of graph work with Categorical explanatory variable and Numerical response variable?
Strip Chart Box plot Multiple histograms Line plot (ordinal only)
What are Stripcharts?
also known as one dimensional scatter plots
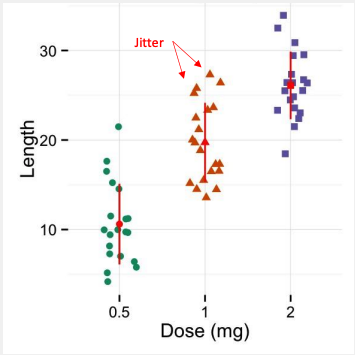
When are stripcharts suitable?
These plots are suitable compared to box plots when sample sizes are small. Jittering is used to separate observations with equal value.
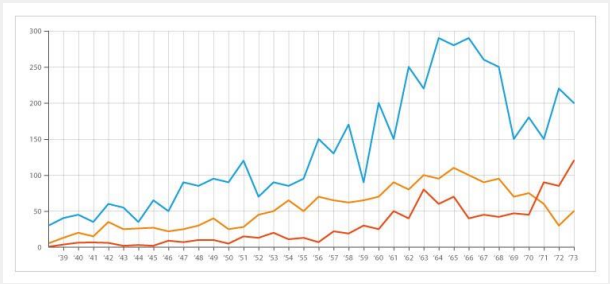
What are line graphs when are they useful?
used to display quantitative values over a continuous interval or time period.
What are the steps for making a good graph?
• Show the data • Make patterns easy to see • Represent magnitudes honestly • Draw elements clearly
Why is showing the data important?
• A good graph allows you to visualise the measurements and helps the eye see patterns in the data. • Showing the data makes it possible to evaluate the shape of the distribution of data points and compare variation between groups. • It helps you spot potential problems.
How does one make patterns easy to see?
• Use colour to highlight trends • Things to be compared should be adjacent. • Keep the axes the same when comparing data across to plots. • Remember the purpose is to communicate essential patterns. If the pattern is not clear, then try another approach.
How does one Represent magnitudes honestly
• Length or area must be proportional to the quantities being displayed. The eye instinctively reads height and area as magnitudes. • Humans are poor at reading areas. • A bar graph musty always have a baseline at zero. Strip charts do not need a zero baseline.
When should you use pie charts?
don’t
What should you do to make sure your elements are draw clearly?
• Cleary label axes and always include units of measurements in the label. Text should be legible and in a simple font. • Avoid chart junk that obscures patterns in the data • Avoid putting too much information into one graph. Remember the purpose is to communicate essential patterns, not to cram all the data into one figure.