The Nature of Stars
No description yet. This curated deck is ready for daily study.
Card preview (18)
What is a parsec?
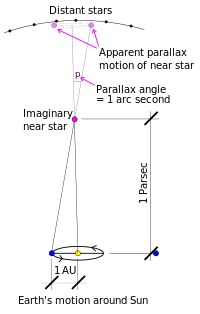
Parsecs (pc) and lightyears (ly) are used as convenient astronomical distance units because they are very large. • A lightyear is simple: the distance light travels in 1 year. • A parsec is DEFINED to be that distance at which a star will have a parallax angle of 1 arcsecond – see next slide. One Parsec (pc) One pc is the distance from which Earth would appear to be one arcsecond from the Sun.
How do you determine the distance to a star?
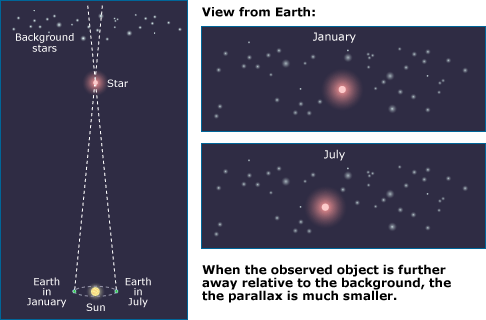
If we are to know exactly how luminous is a star, then we need to know how far it is away. • This is tricky for most stars because of variable interstellar absorption effects. • But for nearby stars we can use Parallax. d=1/p where d = distance in parsecs and p = parallax angle in arcseconds NB 1 AU = 1 astronomical unit (the average Earth-Sun distance)
Gaia - NT
Launched 2013 An ESA mission to measure the distance to 1000 million stars using parallax (1% of the Milky Way) Because it is in space and not limited by the Earth’s atmospheric distortion, it can measure much smaller parallaxes.

How do you determine the luminosity of a star?
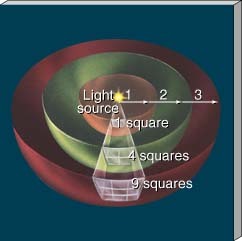
Since starlight spreads out uniformly over a sphere, and we (on the earth) intercept just a part of this light, we need to multiply up to account for the whole sphere of light. If L is the star’s absolute luminosity, and d is its distance, then, b, the apparent luminosity is given by: b = L / (4π d2) (where 4πd2 = the surface area of a sphere)
What is the proper motion of a star?
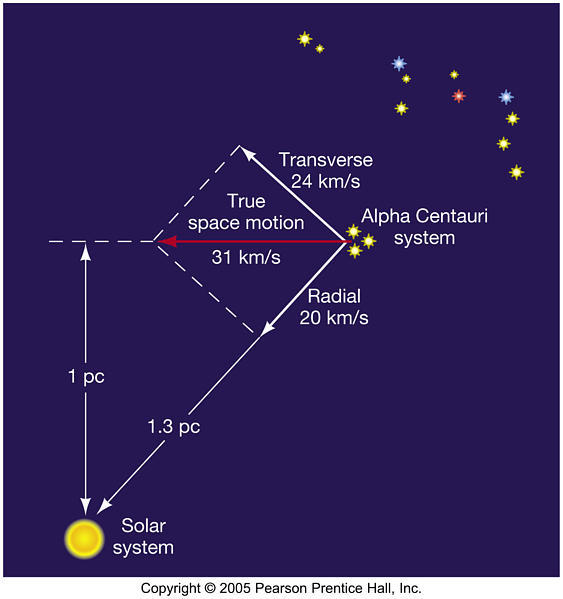
• We cannot directly measure the component of velocity along the line of sight (vr) since this does not cause the position of the star on the sky to change. • But we can determine the tangential component (vt) by observing the changing location of the star at distance d pc. • Proper motion, μ = vt/(4.74d) arcsec/year
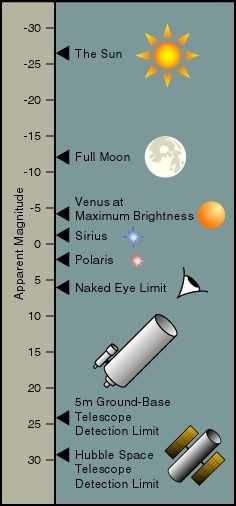
Quantifying brightness - understanding the logarithmic scale
Magnitudes A logarithmic based scale for quantifying brightness. A difference of 1 magnitude corresponds to a factor of 2.5 in brightness. A difference of 5 magnitudes corresponds to 2.5 x 2.5 x 2.5 x 2.5 x 2.5 = (2.5)5 ~ 100 in brightness. • If we have two stars of apparent magnitude of m1 and m2, then they are related to their apparent brightness b1 and b2 by: m2 – m1=2.5 log (b1/b2) …..Eqn 1
Quantifying brightness - absolute magnitude
We observe apparent magnitude, m. What we need to know is the absolute magnitude, M, of an object The absolute magnitude is defined as the magnitude that object would have at a distance of 10pc. So if it’s actually at a distance, d parsecs, away: m – M = 2.5 log (b1/b2) from Equn 1 where b1 is the brightness at 10 pc and b2 is the brightness at d pc. • • • But also we have that b1/b2 = (d/10)2 (brightness falls off as 1/d2) So we have (m-M) = 2.5 log (d2/100) =2.5(log d2 – log100) Finally we have (m–M)=5logd–5 where (m-M) is called the distance modulus to an object.
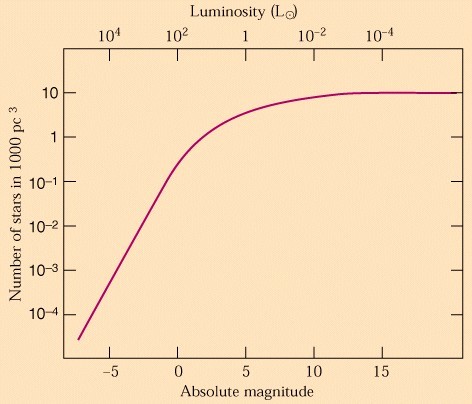
Spread of stars of a given luminosity
The stellar luminosity function reveals how many stars there are of a given luminosity within a volume of 1000 cubic parsecs. Note that the brightest star has the smallest apparent magnitude. i.e. the magnitude scale runs backwards.
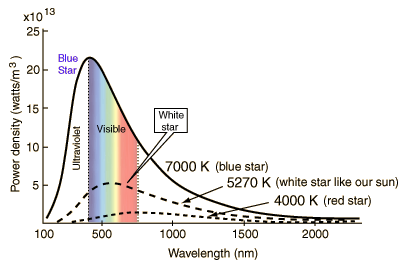
Temperature and colour relationship
Stellar colours depend strongly on the temperature of the star. Red stars are cool, blue stars are hot.
Astronomical Filters
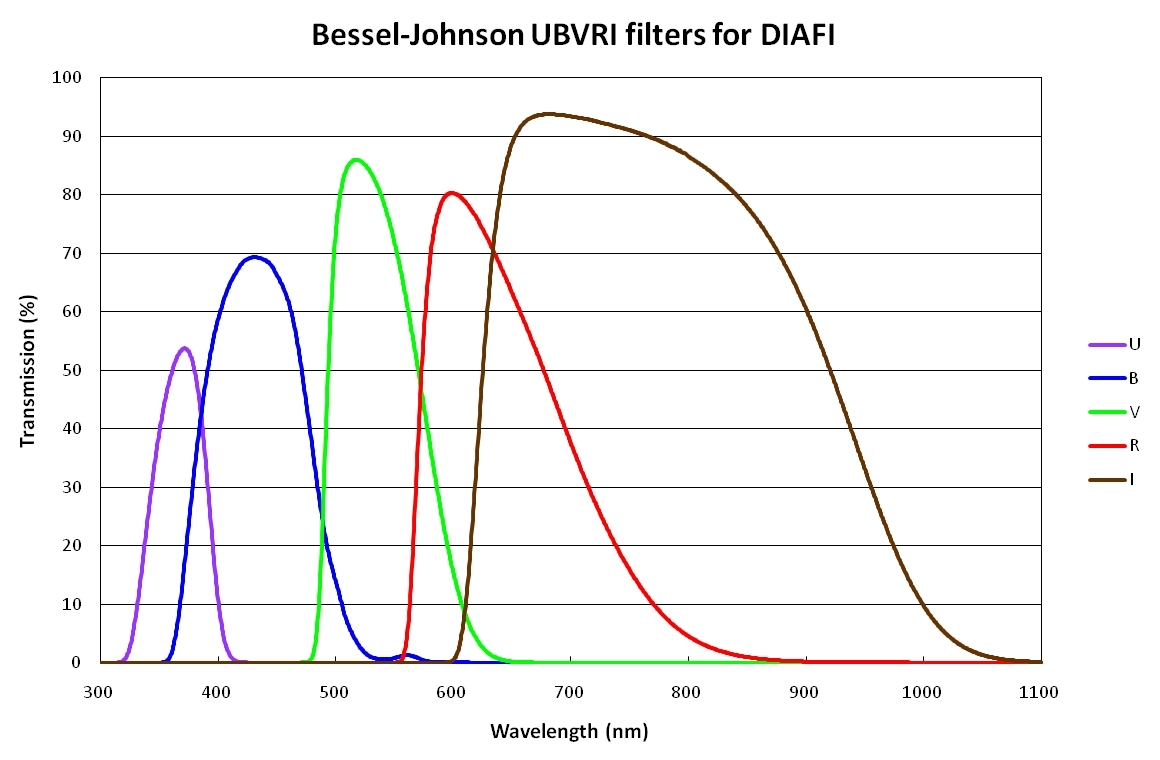
The brightness of stars is normally measured through certain standard coloured filters. • This process is called photometry. • The filters cover the entire visible and IR range and given letters. The most common system, the Johnson-Morgan system, uses: UBVRIJHK
Colour being described as magnitude differences
Because the magnitude scale is a logarithmic one, if we convert the brightness ratios into magnitudes then we end up with the colour being described as magnitude differences : e.g. brightness ratio bB/bV is equivalent to (apparent mag B) – (apparent mag V) or just (B-V).
Classifying stars
Using the spectra of stars it is possible to classify a star as a particular spectral type. • This is done by examining the emission or absorption lines present in a stars spectrum. • For historical reasons the sequence now used is: OBAFGKM This takes us from very hot to very cool stars.
Subclassification
With the advent of superior spectrographs in the last 50 years it became apparent that the OBAFGKM classification needed refining. So each class is now given a number between 0 and 9 to sub-divide the type So we have, for example, A7, G3, B5 etc (the Sun is G2). The key to classification is the relative strength of many different absorption lines from many different elements in the star.
What is a Hertzsprung-Russell diagram?
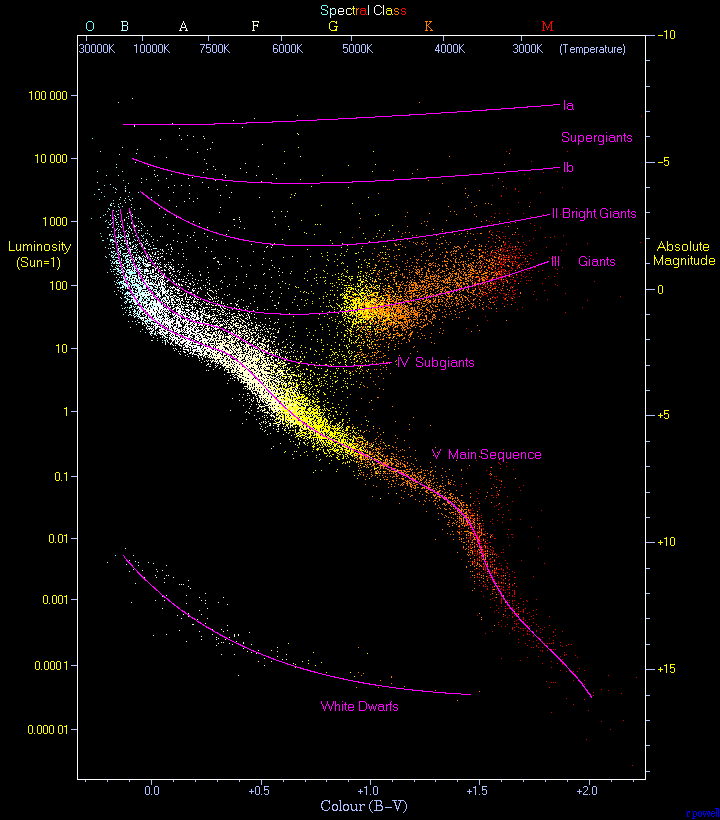
• Discovered independently by a Danish and US astronomer in 1911 • It allows us to understand stars relative to other stars • It allows us to see evolutionary paths for stars The HR Diagram Plot of stellar temperature versus luminosity – note the direction of the temperature axis. The general locations of the more common stars are shown. Note that our Sun sits on the Main Sequence (MS) where many stars spend most of their lives.
Classifying a star by name
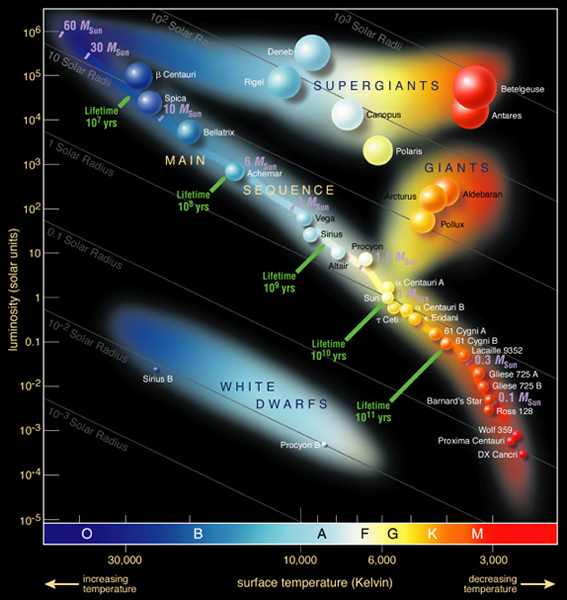
As can be seen from the HR diagram, temperature alone is not enough to classify a star. For example, at T=5800K a star could fall in 4 different luminosities on the diagram: • Supergiant • Giant • Main-sequence • Dwarf
Classifying a star by luminosity
Stars are then further classified into different luminosity classes based upon the width of their emission lines and given a Roman numeral between I and V.
Star classification summary
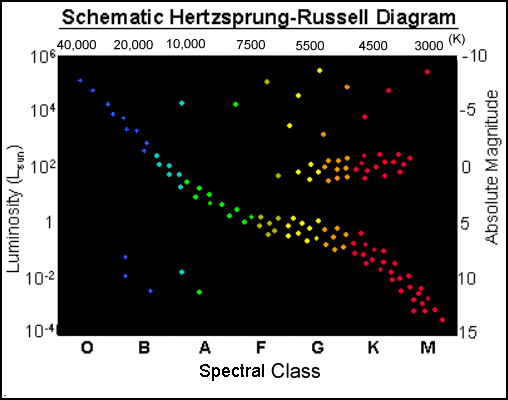
So we now have the full modern designation for a star. Each type name consists of three parts: First a letter from OBAFGKM Second a number between 0-9 as a subdivision Thirdly a Roman number I- V indicating the luminosity class. I-supergiant III-giant V-MS For example, our Sun is a G2V type star.
Mass - Luminosity relationship
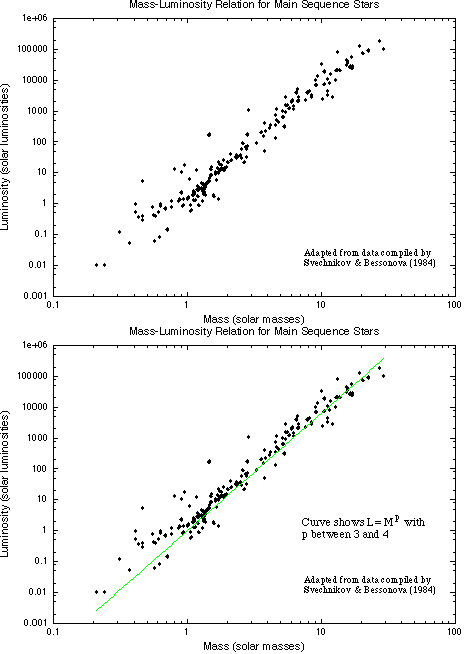
For MS stars there is a strong correlation between stellar mass and luminosity: L= constant M3.5 For example, a star that is 10 times the mass of our Sun is many thousand times more luminous On the HR diagram the physical parameters of MS stars change along its length. From the bottom to the top the mass, luminosity and temperature all increase. So temperature on the HR diagram x- axis can also be represented by the colour (B-V) of a star.